This webpage is a summary of my work with extragactic transients in online survey imagery. As these objects tend to lack spectroscopic data, they are more specifically referred to as “supernova canddiates” when reported to the Transient Name Server (TNS). Note that this page is still under construction.
Photometry: My Method for Estimating Magnitudes in DECaLS Data
In this example, I’ll be going over the steps involved in deriving the photometry required to report a transient. I’ll be using AT 2017khs, a faint extragalactic transient in a distant anonymous galaxy in Pictor. The object was spotted in DECaLS DR10 colour-data based on its peculiar “turquoise” colours (Fig. 1).
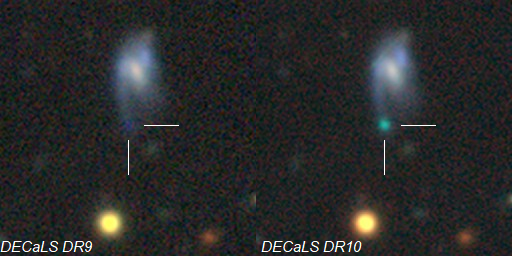
Fig. 1: Discovery images of AT 2017khs Notice how the object appears in the colour-coded DECaLS DR10 images, compared to DECaLS DR9. The turqouise colour further supports the transient nature of the event, considering that the different filters used to recreate this image were taken at different times. Image credit: https://www.legacysurvey.org.
For the photometry, we measure the magnitude of the object in the image in which it was first detected. In this case, it was first visible in a z-filter frame from 2017-12-10 (Fig. 2).
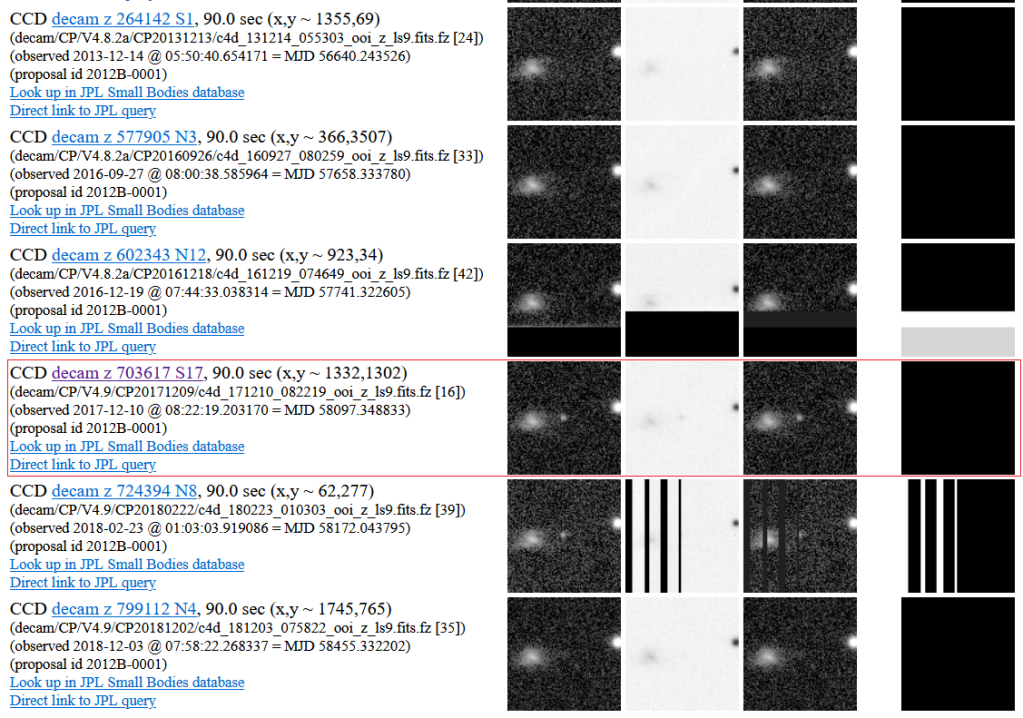
Fig. 2: A list of DECaLS frames available at the lcation of the transient. Screenshot from here.
The method used for the magnitude calculations are rather crude, and could probably be done much more efficiently with a software such as APT. I personally break it down into the following steps:
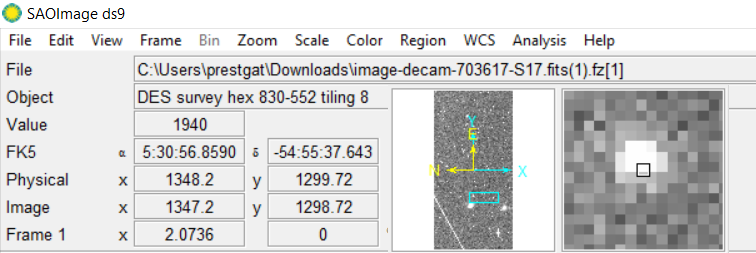
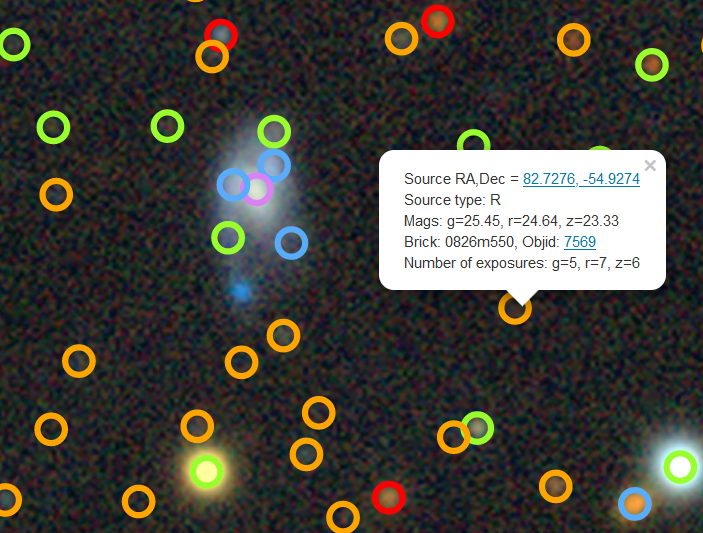
Fig. 3 (top): The maximum pixel intnsity value of the transient in the z-filter frame from 2017-12-10. (bottom): Interface with available DECaLS DR9 magnitudes (screenshot from the legacy sky survey page).
Firstly, I download the original discovery FITS file from the site, and write down the peak Pixel Intensity of for several field stars (Fig. 3-top). I cross-reference these field stars with magnitudes provided online by the Legacy Sky Survey Website (Fig. 3-bottom). I recommend, at least, five stars. Unfortunately, the uncertainty of each of these values are not displayed on the site, and thus not used in my estimations. This is a weakness in my method, specifically when estimating the final values (e.g. uncertainties), and should be noted.
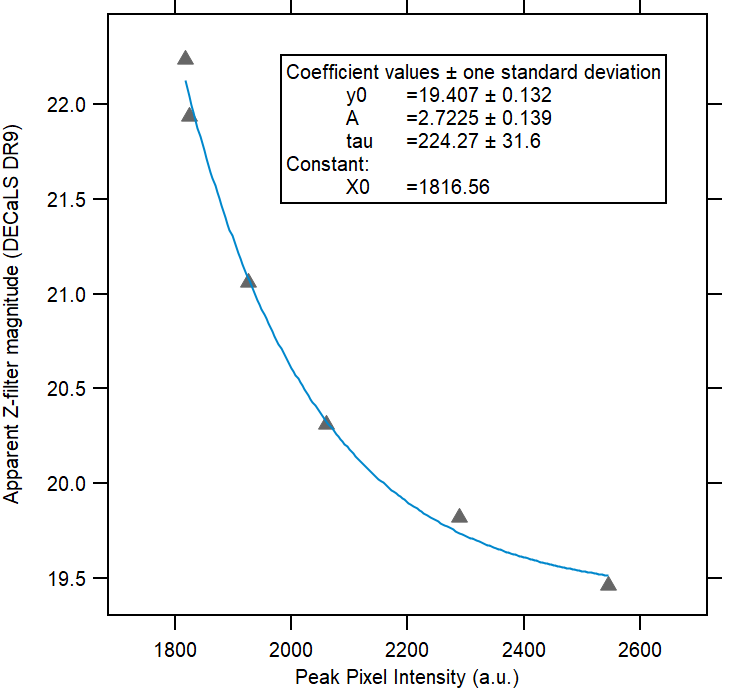
Fig. 4: A clear exponential correlation exists between the peak magnititude of the stars in the field. I fit the curve with IGOR Wavemetrics, which also provides the standard deviation for the fit, which helps for the uncertainty calculations.
Secondly, I plot these values using a software that can fit data with functions (in this case, I used IGOR Wavemetrics Pro). The relation is clearly exponential in nature (Fig. 4), and in this case, can be defined as expression (1). The values for each of the variables ar provided in Fig. 4. The fit also provides the standard deviations for each of these variables, which I then use to crudely estimate the uncertainties (see below).
[Insert expression]
Using this expression, the estimated value of the transient is z= 21.0 mag (I only consider one significant digit, as I cannot be very precise). I then replace each variable of the expression with plus and minus the double of their estimated standard deviation. I obtain z(max)= 21.6 mag and z(min)= 20.3 mag. My final estimations are z= 21.0 +/- 0.7 mag. My guess is that the uncertainties are somewhat exagerated, but this makes the estimated range more reliable.
Finally, with this information, I post the following when reporting the object to the TNS:
The z-band apparent magnitude was calculated based on the interpolation of z-band values of six field stars using SAOImageDS9 (ranging from z= 19.46 to R=22.24). The magnitudes of these reference stars were extracted from the DECaLS DR9 Imaging catalogue. The method is described on the following webpage: https://skyhuntblog.wordpress.com/my-archival-hunt-for-extragalactic-transients/
Note that this same method was not applied to the first transients that I reported (I used Excel): AT 2013lp, AT 2014hr, AT 2017kkh and 2018mcm, hence the absence of uncertainties. Those from 2017kkh were already provided by the DECaLS DR9 imaging catalogue, and were accurate enough to directly include into the TNS report.
Supernova Candidate List
| Designation | Discovery Frame | Discovery Frame Date | Discovery Magnitude | TNS link |
| AT 1976S | 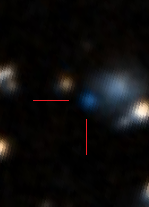 | 1976-05-31 16:39:00 (DSS) | B= 17.8 | TNS VSX |
| AT 1978M | 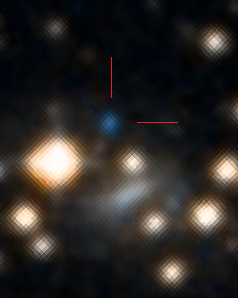 | 1978-01-09 14:28:00 (DSS) | B=17.9 | TNS VSX |
| AT 1993an | 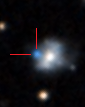 | 1993-10-20 05:30:00 (DSS) | B=16.3 | TNS VSX |
| AT 2013lp | 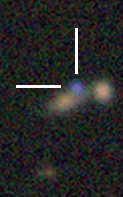 | 2013-10-03 02:41:16 (DECaLS) | g=21.8 | TNS |
| AT 2014hq | 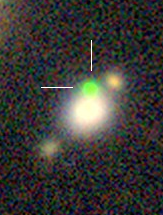 | 2014-11-21 07:42:58 (DECaLS) | R=19.0 | TNS |
| AT 2014hr | 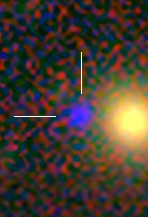 | 2014-10-29 05:55:23 (DECaLS) | R= 22.0 | TNS |
| AT 2017khh | 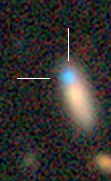 | 2017-07-22 08:03:30 (DECaLS) | g= 19.99 | TNS |
| AT 2018mcm | 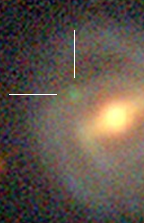 | 2018-08-10 07:12:26 (DECaLS) | R= 20.6 | TNS |
| AT 2017khs |  | 2017-12-10 08:22:19 (DECaLS) | z= 21.0 ±0.7 | TNS |
| n.a. |  | 2014-04-22 02:39:19 (DECaLS) | g= t.b.d. | n.a. |
| n.a. | 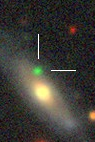 | 2015-06-07 06:13:55 (DECaLS) | R= t.b.d. | n.a. |
| AT 2017kif | 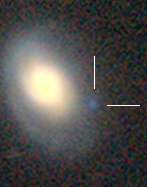 | 2017-09-12 01:57:43 (DECaLS) | R=21.4±1.0 | TNS |
| AT 2017kie | 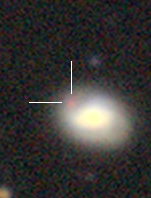 | 2017-11-10 07:13:26 (DECaLS) | z=20.1±1.0 | TNS |
| AT 2015fr | 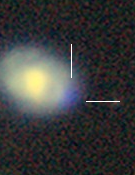 | 2015-11-11 02:08:47 (DECaLS) | g=20.2±2.0 | TNS |
| Awaiting | 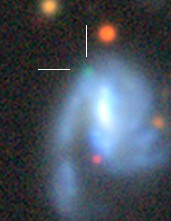 | 2017-11-09 08:12:37 (DECaLS) | z=t.b.d. | t.b.d. |
| Awaiting | 2013-10-28 05:49:52 (DECaLS) | g=t.b.d. | t.b.d. | |
| Awaiting | 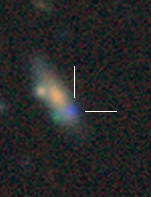 | 2019-11-26 04:30:53 (DECaLS) | g=t.b.d. | t.b.d. |
| Awaiting | 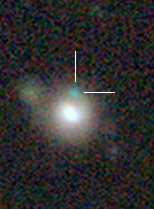 | 2016-01-11 07:56:17 (DECaLS) | R=t.b.d. | t.b.d. |
| Awaiting | 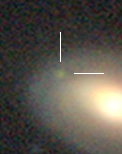 | 2013-11-11 07:58:39 (DECaLS) | g=t.b.d. | t.b.d. |
| Awaiting | 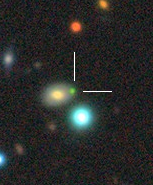 | 2014-10-14 03:48:46 (DECaLS) | g=t.b.d. | t.b.d. |
| Awaiting | 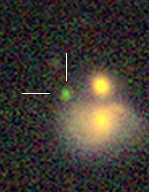 | 2017-03-05 00:26:03 (DECaLS) | z=t.b.d. | t.b.d. |
| AT 2019aare | 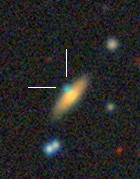 | 2019-01-11 10:01:01 (DECaLS) | g= 20.9 ±1.7 | TNS |
| n.a. | 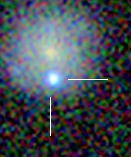 | 2004-04-16 (SDSS) | t.b.d. | n.a. |
| Awaiting | 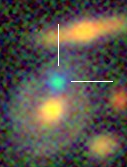 | 2016-03-09 07:17:01 (DECaLS) | g=t.b.d. | t.b.d. |
| Awaiting |  | 2018-08-09 02:17:56 (DECaLS) | g=t.b.d. | t.b.d. |
| Awaiting |  | 2017-03-17 05:49:24 (DECaLS) | z=t.b.d. | t.b.d. |
| Awaiting |  | 2015-03-19 03:57:22 (DECaLS) | g=t.b.d. | t.b.d. |
| Awaiting | 2017-09-20 07:17:58 (DECaLS) | g=t.b.d. | t.b.d. | |
| Awaiting | 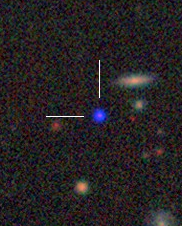 | 2017-01-26 10:44:22 (DECaLS) | g=t.b.d. | t.b.d. |
| AT 2021aiay | 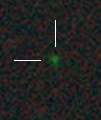 | 2021-04-09 02:48:50 (DECaLS) | R=23.08 | TNS |
| Awaiting |  | 2020-01-21 06:38:30 (DECaLS) | g=t.b.d. | t.b.d. |
Other Types of Extragactic Transients
[to complete]
